Correlation just means that two things occur at the same time, cause and effect means that one of those things causes the other to occur. Just because more people get sunburns during the same time of the year that more people eat ice cream, it doesn’t mean ice cream causes sunburns.
Now they may not all be as simple as the above example, but knowing the difference between correlation and cause and effect is important. In this article we’ll go over how to identify the correlation vs cause and effect, and why it matters in real life.
Jump To Section
What Is Correlation?

Correlation is a statistical measure that indicates the extent to which two variables change in relation to each other. Our example about ice cream and sunburns is correlated because they both trend in a direction together.
This doesn’t necessarily indicate that one is causing the other, but it does indicate a correlation. Correlation can be positive (both variables rise together), negative (one goes up, the other goes down), or zero (no pattern). By understanding these connections we can better navigate data, make more informed predictions and avoid making hasty assumptions.
How We Measure Connection Strength
The strength of any given correlation is quantified by a value called a correlation coefficient. This correlation value ranges from -1 to +1. Positive numbers indicate a direct relationship, negative numbers indicate an inverse relationship, and zero indicates no relationship. The most common ways to check these are:
- Pearson’s r (for linear relationships)
- Spearman’s rank (for data that isn’t perfectly straight)
- Kendall’s tau (for small samples or ranked data)
Visualizing Correlated Data Points
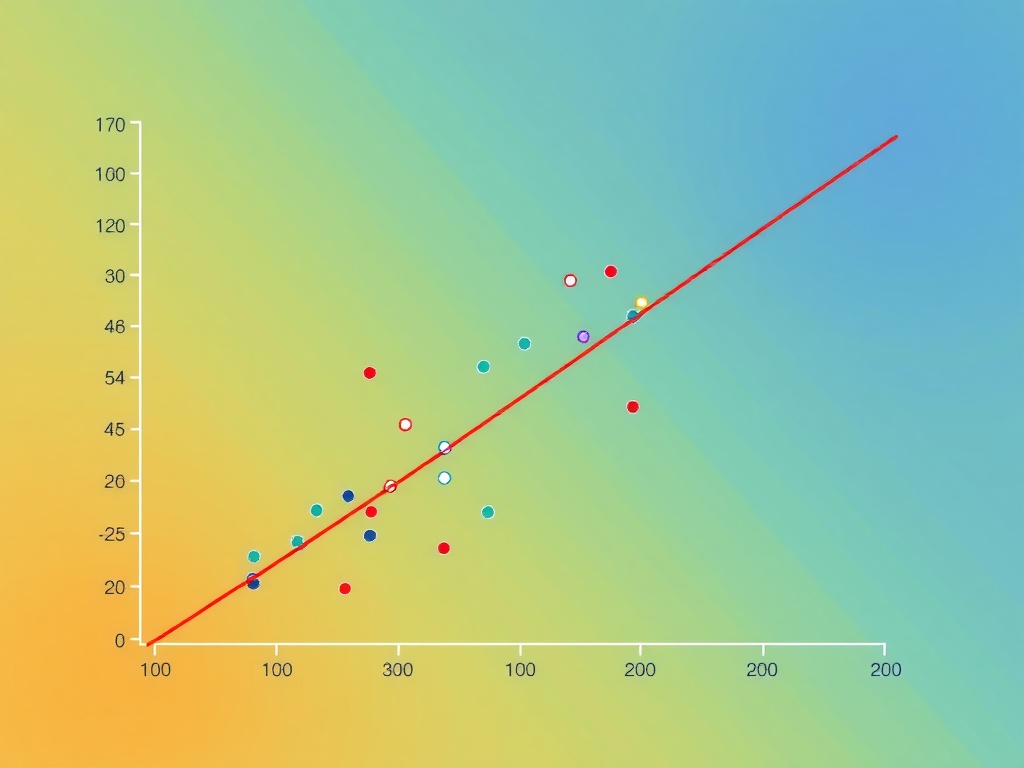
Scatter plots are a great way to bring relationships to life. Put a trend line on it, and you start to can see the correlation. For more comparison, try:
Visualization | Best Use |
|---|---|
Scatter Plot | Seeing raw relationships |
Heatmap | Comparing many variables |
Line Graph | Showing trends over time |
Understanding True Cause and Effect

Causation is when one event directly causes the other to happen, such as when you flip a light switch and the room fills with light. Understanding true cause and effect is crucial for developing the right solutions, whether you’re driving in traffic or analyzing business intelligence.
The “Why” Behind Events
Determining true cause and effect requires going deeper with an eye toward why things change. Is workplace stress leading to more headaches, or do headaches just tend to occur on hectic days? Other times, a third variable, such as insufficient sleep, may be the culprit, making it hard to see true cause and effect.
That’s why you shouldn’t stop at asking “why” just once. You can use the simple “5 Why” technique to dig a little deeper and help find the true cause. Look beyond the obvious rather than rushing to judgment based on trends alone.
Why Proving Causation Is Tough
To prove causation means proving that one event occurs prior to the other and that no alternative explanation applies. Sometimes, the variables are just randomly associated (spurious relationships), or it’s not obvious which one is the cause and which one is the effect (directionality problem).
Correlation vs Causation: Key Differences
Correlation and causation are often confused, but they are not synonymous.
Failing to be able to understand correlation vs causation correctly can lead us astray, towards misguided and misallocated time and resources.
1. Just Because It’s Linked…
pEver watch two things increase and decrease and assume, there’s got to be a relationship between them! Not necessarily. For example, there is a strong correlation between ice cream consumption and drowning deaths. Does that mean ice cream causes more drownings. probably not. They’re a correlation linked by summer weather.
2. The Hidden “Third Wheel” Problem
Occasionally, a third, more hidden variable impacts both variables in a correlation. This hidden variable can create an illusion of correlation between two unrelated things. Like the summer heat actually causing the increase in ice cream consumption and drownings. The best researchers are always on the lookout for these hidden influences, answering the question, “Is there something else going on here?”
3. Which Came First? Direction Matters
Causation isn’t merely an association, it’s about the direction of the lead. Did A really cause B, or was it the other way around, B causing A? Perhaps neither was the cause of the other. To untangle direction, ask:
- Did the cause happen before the effect?
- Is there a plausible mechanism?
- Are other explanations possible?
- Has this relationship been seen elsewhere?
4. Spotting Pure Coincidence Clearly
Some correlations are simply random coincidence. In other words, global pirate numbers have dramatically decreased over the past century. While the average global temperatures have increased in almost perfect correlation, but pirates don’t govern the climate. In short, coincidences don’t equate to causation. To address this concern, researchers always test for statistical significance to filter true patterns from mere coincidence.
How to Test for Causation

Finding true cause and effect from mere correlation is like removing the layers of an onion. You peel it back layer by layer and find a few hidden gems under there!
The Power of Controlled Tests
The Power of Controlled Tests Controlled experiments really excel when it comes to isolating variables. Picture two groups: one gets the treatment, the other doesn’t. Randomization helps ensure that both groups are equal to start with, removing bias and third variable issues. Some of the most well-known examples span from pharmaceutical clinical drug trials to educational interventions in classrooms.
Hypothesis Testing: A Quick Guide
Hypothesis testing adds formality and structure. Formulate a clear hypothesis, choose a test (like t-test or ANOVA), and interpret results in context:
Sound methods plus solid reasoning deliver trustworthy answers.
Applying Insights: Make Better Choices
Knowing the difference between correlation and causation isn’t just for statisticians. It determines the rules of the economic game, whether in the boardroom, at the ballot box, or on the street. When you see a correlation between two items, say coffee consumption and work output, it’s tempting to make assumptions. Real growth comes from asking: does one thing actually cause the other, or are they just moving together by chance?
Use Findings for Real Growth
The key to success is to use the groundbreaking, powerful insights data provides to inform your decisions. Growth-minded leaders understand that data isn’t enough. It has to be connected to outcomes. If a company sees a correlation between remote work and employee satisfaction, it’s smart to dig deeper before overhauling policies. Getting the narrative wrong on the data will blow up in our faces. Growth is a process of learning, testing, and realigning over and over again.
Wrapping It All Up: Why Correlation Isn’t the Whole Story
After all that number crunching and pattern hunting, what are we actually left with? Let’s say you observe some sort of correlation, like between ice cream sales and sunburn occurrences. That doesn’t mean one is doing the causing. The problem with correlation, it’s tempting to ride the high of a good correlation. Real cause and effect takes a bit more digging and a whole lot of skepticism.
Asking questions, checking the facts, and running tests help you avoid costly mistakes, whether you’re making decisions at work or in daily life. In the end, understanding the difference between correlation and causation gives you a sharper, more reliable way to read the world.


